Animated Census Data with R
In the Fall of 2023 I used R to create a method for generating gifs that show demographic data over time. The purpose for this tool is to illustrate patterns of mobility for wealth, race, education, and more. Using census data, users can specify what type of information they would like to see as well as select the geographical region of interest. This project takes advantage of the R packages tidycensus, gganimate, and gifsky.
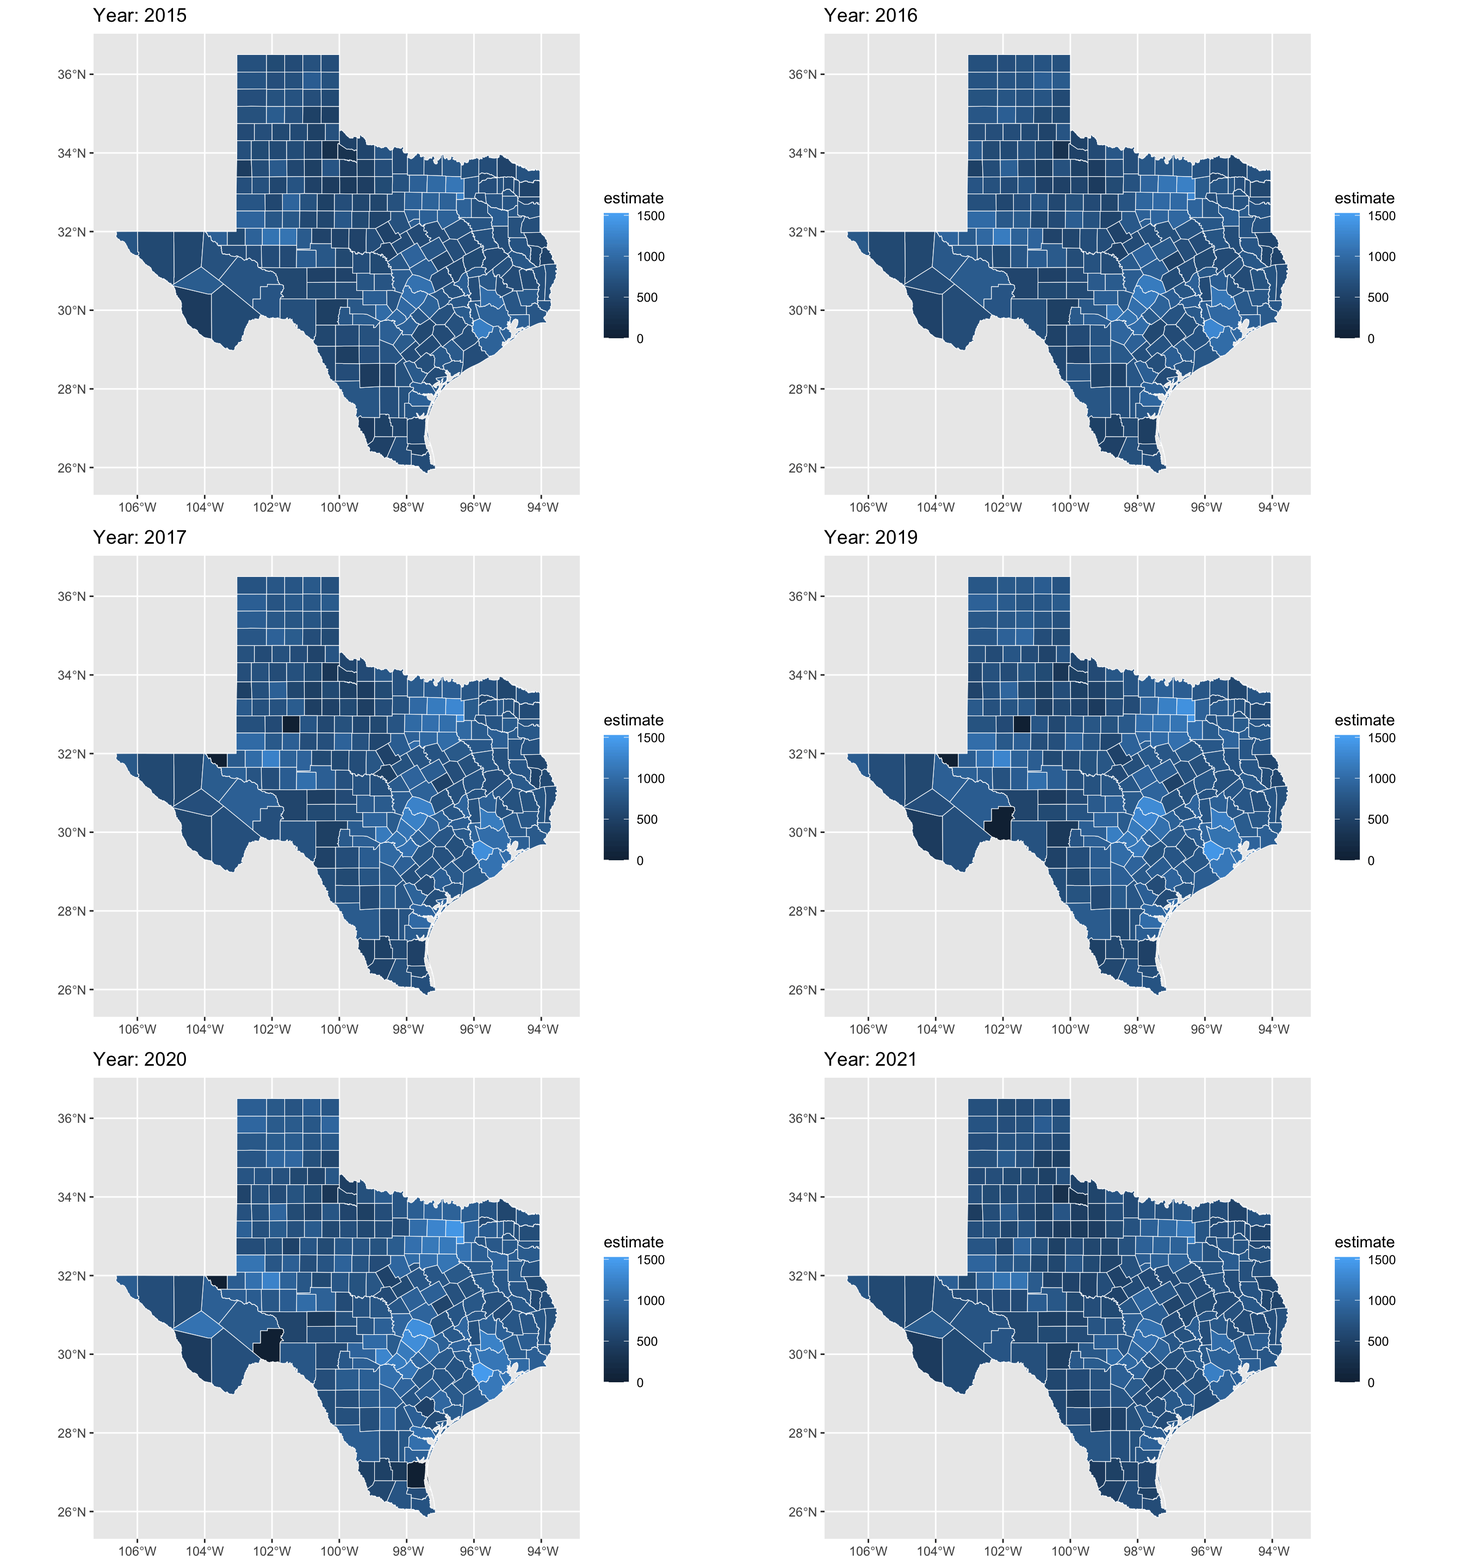
The gif below shows median gross rent for Texas counties from 2015-2021:
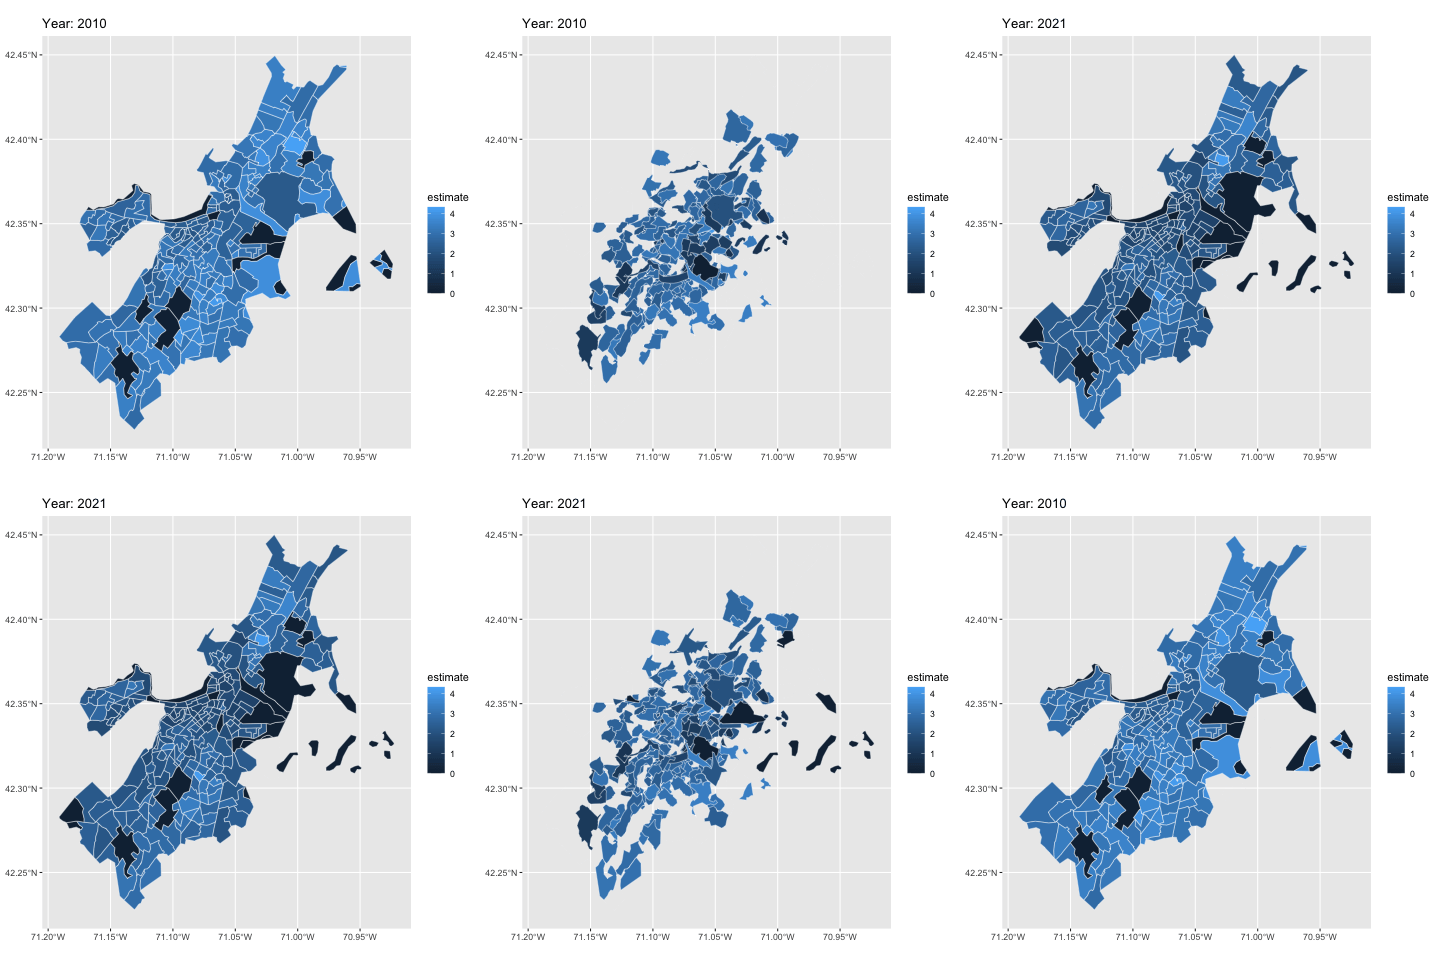
This gif shows average family size for Suffolk County, MA land in 2010 & 2021:
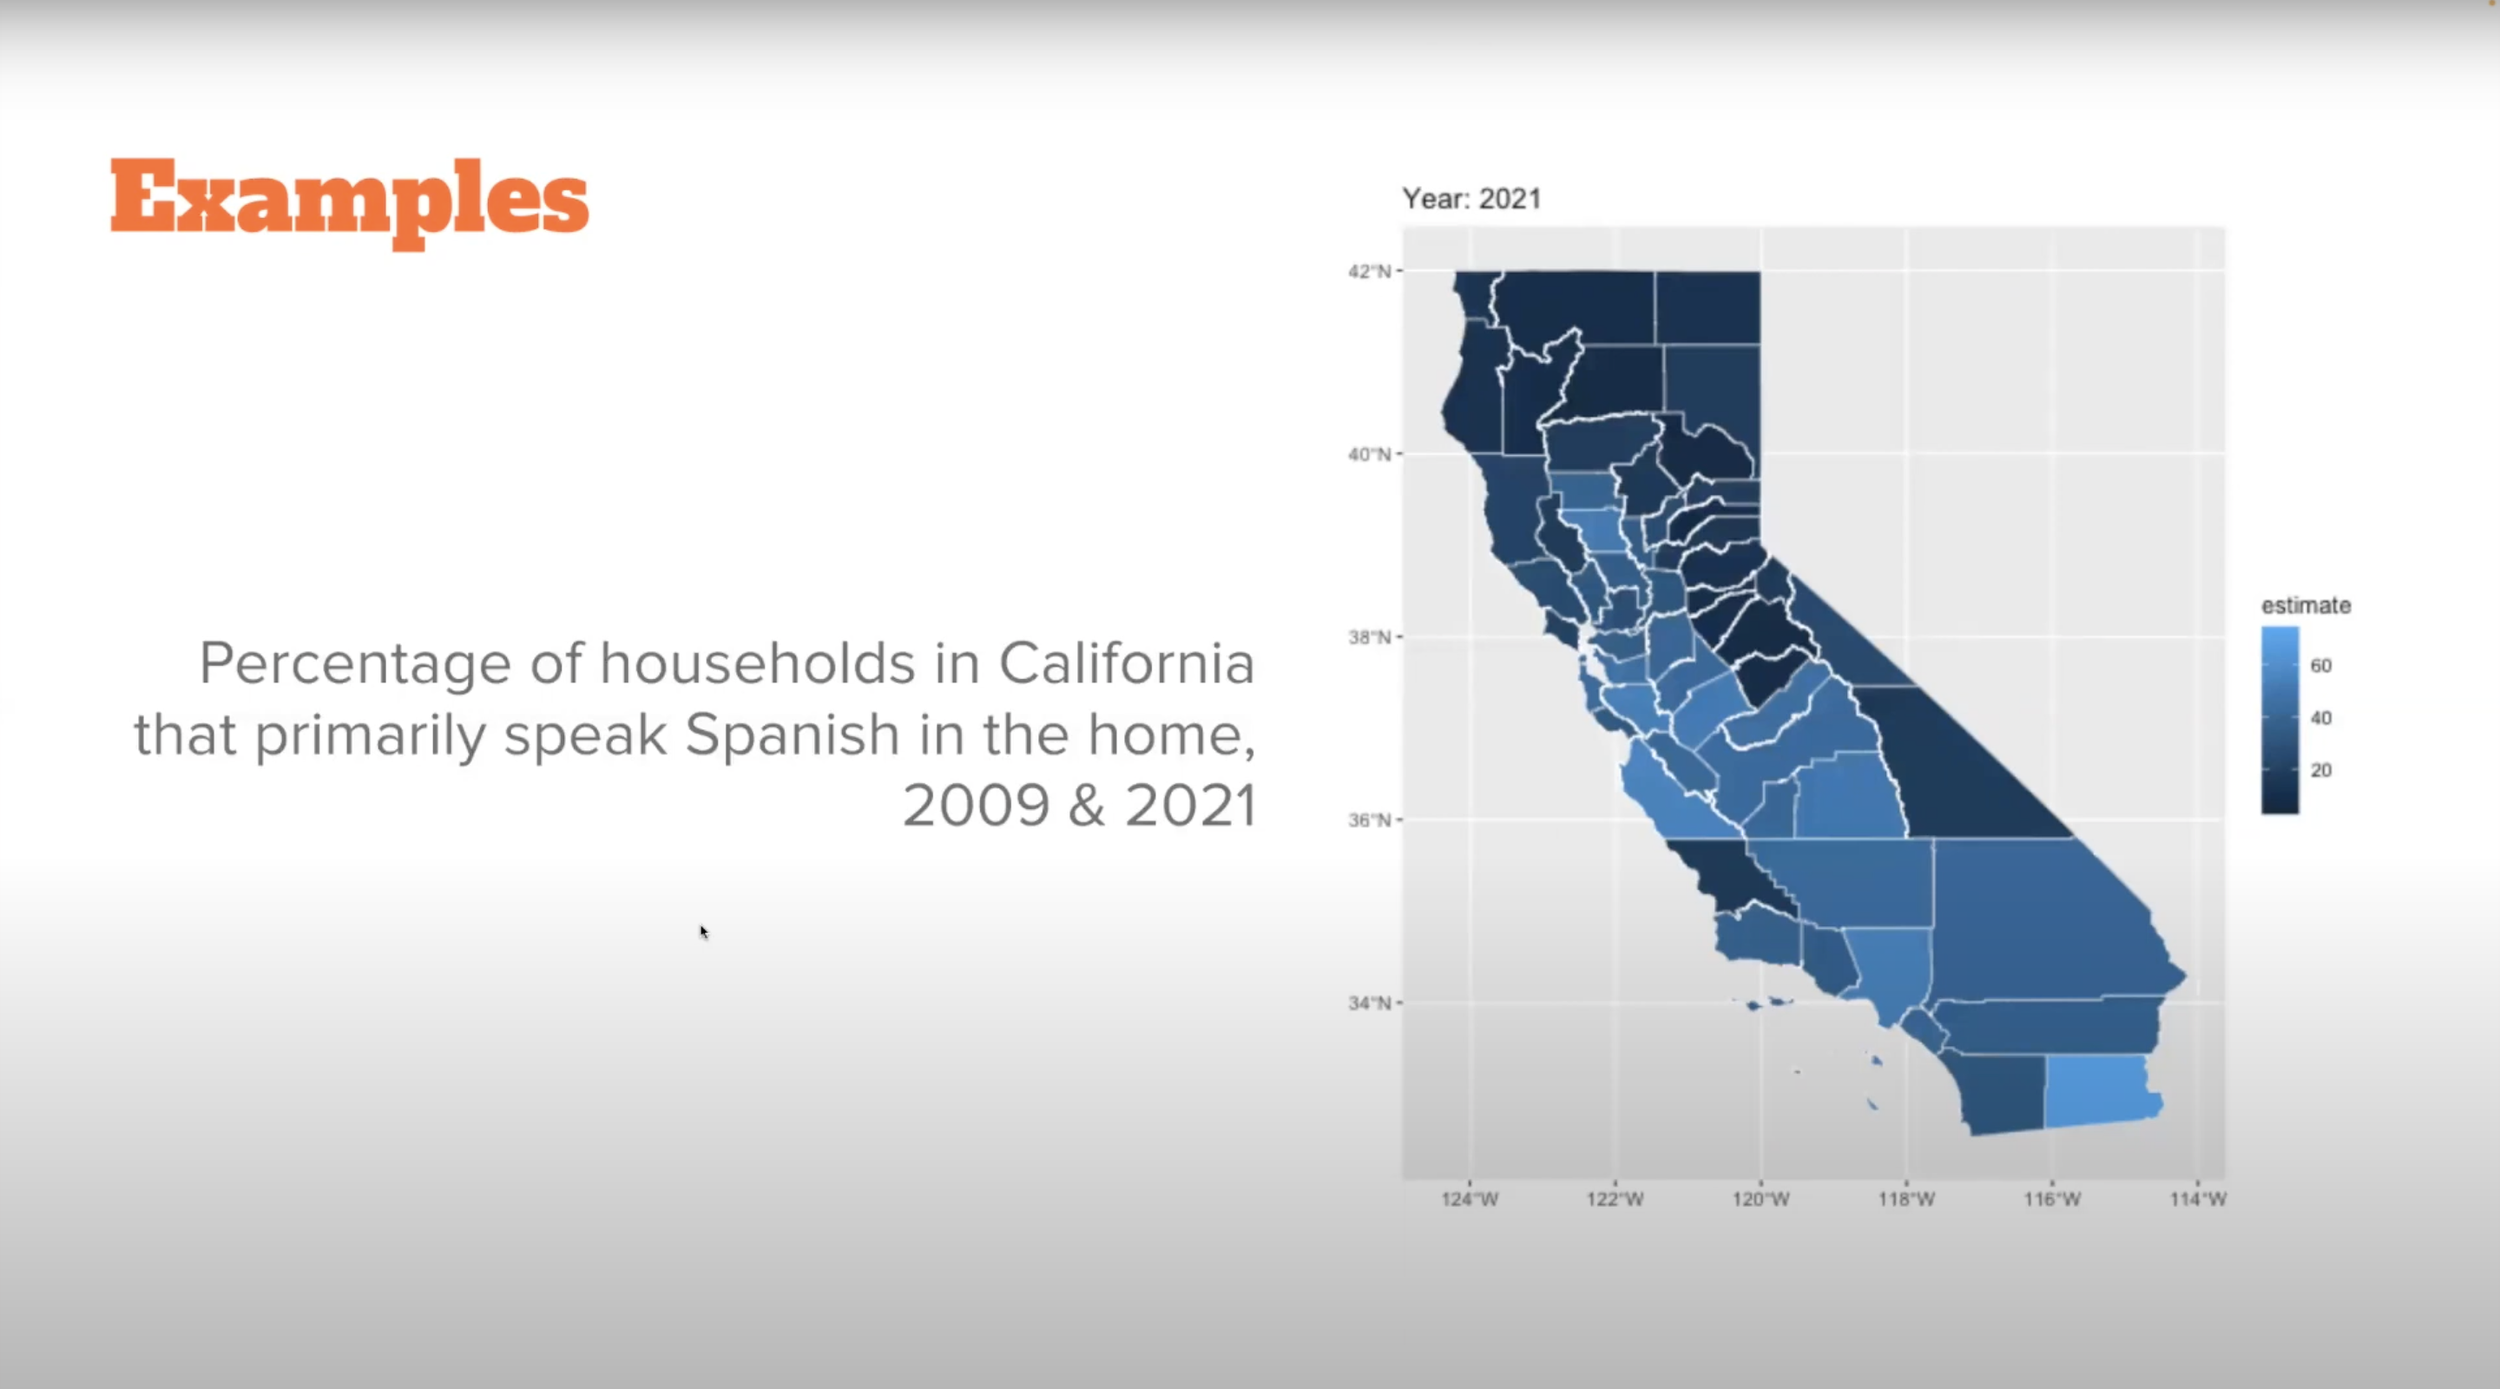
Here is a video presentation I created explaining this project


